Building an AI Trading Bot — Week One: Why a 90 % Win Rate Can Still Lose Money

📊 Full opportunity report: Building an AI Trading Bot — Week One: Why a 90 % Win Rate Can Still Lose Money on ThorstenMeyerAI.com — validation score, market gap, and execution plan.

TL;DR

An experimental AI trading bot shows many strategies with over 90% win rates, but these do not necessarily lead to profitability. The first week’s data highlights the importance of understanding market-implied probabilities and strategy quality.

Initial testing of an AI trading bot on simulated short-term binary markets reveals that strategies with over 90% win rates do not guarantee profitability, emphasizing the importance of market context and strategy quality.

The researcher has been running a set of 21 strategy variants on simulated crypto prediction markets, with some strategies achieving win rates above 90%. However, these high win rates are primarily due to trading late in the market when the outcome is nearly certain, not because of genuine predictive edge.

When adjusted for market-implied probabilities—rather than naive 50% expectations—the apparent edge disappears. Strategies that appear highly successful based on raw win rates often break even or lose money once market odds are considered.

Among the strategies tested, only one shows signs of potential genuine edge: it has a below-50% win rate but produces larger wins than losses, resulting in a net positive profit over hundreds of trades. Still, the sample size remains too small to confirm this as a reliable edge.
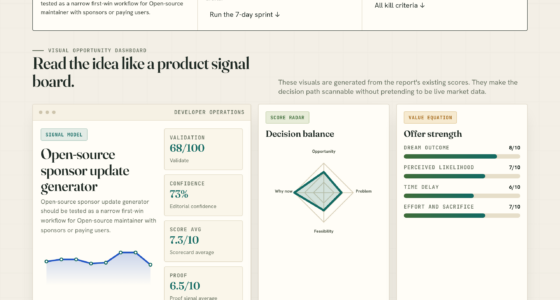
Building an AI Trading Bot · Week One · The Win Rate Trap.
DISPATCH / PAPER TRADING RESEARCH AI TRADING BOT · WEEK ONE · WIN RATE TRAP · SIMULATED FUNDS
▲ NOT FINANCIAL ADVICE Paper trading · simulated funds only · research lab
Building an AI Trading Bot · Part 1 of an ongoing series

Week one.
Why a 90% win rate
can still lose money.

21 strategies running in parallel · 700+ settled paper trades · 18 of 21 with reasonable win rates · 2 variants at 100% wins. And almost none of it means what it looks like.

An experimental AI-driven trading bot running 21 strategy variants against 5-minute binary prediction markets on major crypto assets. Every trade is paper — simulated funds only. Headline numbers look extraordinary: 18 of 21 variants with reasonable win rates · entire fleet on one underlying with >90% wins · two specific variants at 100% wins over 38-44 settled trades. The data is telling a very different story than the leaderboard suggests. Most of the "winning" strategies are buying when the market has already priced one side at 90-95 cents on the dollar — the right baseline isn't 50%, it's the market-implied probability, and below 95% wins on that math is a slow bleed. One strategy — and only one — has the opposite signature: below-50% win rate, 2.5× average winning trade vs losing trade, meaningfully positive net P&L over several hundred settled positions. The right signature. The smoking-gun negative result: same code running on different assets is statistically significantly losing money. Same model, same parameters, different markets, different results — that's data you'd pay for.

!
▲ Not financial advice · simulated funds only · research lab
The bot described here trades exclusively with simulated money. Nothing in this article should be used to inform real trading decisions. If you build something similar and run it with real funds, you should fully expect to lose them — that is the most likely outcome, by a wide margin, regardless of what early numbers suggest. Prediction markets are zero-sum after fees, dominated by sophisticated participants, and structurally hostile to part-time retail strategies.
▲ The structural editorial finding · week one
Win rate is the wrong metric. P&L distribution and expected value are everything. A 95%-win strategy that loses 19× as much when it's wrong is a worse trade than a 45%-win strategy that pays 2× as much when it's right. The right null hypothesis is not "random" — it's "whatever the market is already pricing." A strategy that works equally well on everything is almost always a fluke; a strategy that works narrowly is doing something.
— building an ai trading bot · week one · the win rate trap · paper trading research lab
21
Strategy variants running in parallel · 4 strategy families × 4 underlyings · each on its own simulated bankroll
Real market data · real order books · real fees · real latency model · simulated funds only · research lab not wallet
700+
Settled paper trades across the fleet · enough to reject "obviously useless" · nowhere near enough to claim "real edge"
18 of 21 variants showing reasonable win rates · entire fleet on one underlying at >90% wins · 2 at 100% over 38-44 trades
1
Strategy with the right edge signature · <50% win rate · 2.5× win:loss ratio · meaningfully positive net P&L
Fair-value style model on most liquid underlying · candidate worth watching · sample still too small to call
99%
Confidence on cross-asset negative result · same code statistically significantly losing money on other underlyings
Same model · same parameters · same code path · different volatility regime + microstructure · different result · informative
90% WIN RATE TRAP SNIPER-STYLE VARIANTS · 19× LOSSES VS WINS · NET NEGATIVE P&L · MECHANICAL ILLUSION BASELINE IS NOT 50% MARKET-IMPLIED PROBABILITY IS THE RIGHT NULL · 95% PRICED IN = 95% NEEDED TO BREAK EVEN CANDIDATE SIGNATURE <50% WINS · 2.5× WIN:LOSS · MEANINGFULLY POSITIVE · ORDER OF MAGNITUDE MORE TRADES NEEDED CROSS-ASSET NEGATIVE SAME CODE, DIFFERENT MARKETS, DIFFERENT RESULTS · 99% CONFIDENCE NEGATIVE-EDGE ON ONE VARIANT RUN-TO-ZERO DRAWDOWN GATES DISABLED AS TEACHING EXERCISE · $300 BANKROLL EVAPORATED · INFORMATIVELY MOST STRATEGIES ARE FLAT-TO-LOSING · 1 OF 21 WORTH MORE INVESTIGATION · REST ARE ILLUSIONS, LOSERS, OR NOISE
The 90% win rate trap · asymmetric P&L · the math

90% wins. Still net negative.

Most of the "winning" strategies in the fleet are buying when the market has already decided one side is going to win. They wait until one outcome is priced around 90-95 cents on the dollar, then take the favorite. If the favorite holds, the trade pays a few cents. If it doesn't, the trade loses almost the entire bet. The asymmetry makes the high win rate structurally meaningless.

The asymmetric-P&L math · 90% wins ≠ profit
The 10 winning trades pay a few cents each. The 1 losing trade loses almost the entire bet. The right question is not "do you win more than half the time?" — it's "do you win at the rate the market is already pricing in?"
▲ Sniper-style variant · 90% wins
Mechanical illusion
10 trades × +$0.05 = +$0.50 won
1 trade × −$0.95 = −$0.95 lost
−$0.45 net11 trades · 90.9% win rate · negative P&L
▲ Candidate signature · <50% wins
Real edge
4 trades × +$2.50 = +$10.00 won
6 trades × −$1.00 = −$6.00 lost
+$4.00 net10 trades · 40% win rate · positive P&L
▲ The right baseline · market-implied probability, not coin-flip
If the market is pricing the favorite at 95% to win, you need to win at least 95% of those trades just to break even after the asymmetric payoff. Anything less than 95% is a slow bleed, regardless of how confident the percentages look. A high win rate, by itself, tells you almost nothing about whether a strategy has edge — it tells you about the kind of trades being taken, not the quality of the decisions.
The candidate signature · what real edge looks like
Use Claude to Build 7 AI Trading Bots: Stocks, Options, Crypto. The Multi-Strategy Playbook used for Backtesting and Live Trading (AI Trading Bot Series)

Use Claude to Build 7 AI Trading Bots: Stocks, Options, Crypto. The Multi-Strategy Playbook used for Backtesting and Live Trading (AI Trading Bot Series)

As an affiliate, we earn on qualifying purchases.

As an affiliate, we earn on qualifying purchases.

One candidate. Right signature.

After dismissing the high-win-rate experiments as mechanical illusions, the search shifted to the opposite signature — a strategy that loses more often than it wins but still makes money. That's the mathematical fingerprint of a real prediction signal: bigger wins than losses, willing to be wrong frequently in service of being right with conviction.

The candidate signature · <50% wins, 2.5× win:loss, net positive
Fair-value style model on the most liquid underlying. One strategy in the fleet — and currently only one — looks like a real edge signature. Sample still too small to call. Running for at least an order of magnitude more trades before claiming more than "candidate worth watching."
▲ Win rate
<50%
Wrong more often than right. Willing to lose frequently in service of being right with conviction — the mathematical fingerprint of real edge.
▲ Win:loss ratio
2.5×
Average winning trade is roughly 2.5× average losing trade. Asymmetric P&L on the right side — bigger wins than losses produces positive expected value at <50% accuracy.
▲ Net P&L
+
Meaningfully positive over several hundred settled positions. Fair-value style model not momentum/favorite-rider · most liquid underlying · the right edge signature.
▲ The caveat · sample still too small to call
A few hundred settled trades is enough to reject "obviously useless" — it is nowhere near enough to confidently claim "this is real edge that will persist." A favorable variance window of the right length can produce numbers that look exactly like this without any underlying skill at all. Running for at least an order of magnitude more trades before claiming more than "this is the candidate worth watching."
Cross-asset negative result · the smoking gun
The No-BS Guide to Prediction Market Arbitrage: AI-Powered Strategies for Polymarket & Kalshi — Find Arbitrage, Manage Risk & Profit from Real-World Events ... Code (The No-BS AI Playbooks Book 5)

The No-BS Guide to Prediction Market Arbitrage: AI-Powered Strategies for Polymarket & Kalshi — Find Arbitrage, Manage Risk & Profit from Real-World Events ... Code (The No-BS AI Playbooks Book 5)

As an affiliate, we earn on qualifying purchases.

As an affiliate, we earn on qualifying purchases.

Same code. Different markets.

The strongest evidence that the candidate strategy might be real comes from an unexpected place: running the exact same code on different assets produces statistically significant losses. Same model, same parameters, same code path, different volatility regime, different microstructure, different result.

Cross-asset negative result · same model, different outcomes
A strategy that works equally well on everything is almost always a fluke. A strategy that works on one specific market structure and fails on others is doing something. The cross-asset variants ran themselves down toward zero, generating clean evidence the underlying model is not universal.
▲ Underlying 1
Most liquid
+ Positive
Meaningfully positive net P&L. Candidate signature. <50% wins · 2.5× win:loss · several hundred trades.
▲ Underlying 2
Cross-asset
− Negative
Statistically significantly losing. Same model · same parameters · different volatility regime.
▲ Underlying 3
Cross-asset
− Negative
99% confidence negative-edge. Same code path · different microstructure · ran itself down toward zero.
▲ Underlying 4
Cross-asset
− Negative
Bankroll evaporated. Risk gates disabled as teaching exercise · $300 simulated bankroll · informatively.
▲ The structural finding · informative in a way "everything's green" never is
The cross-asset variants ran themselves down toward zero, generating clean evidence the underlying model is not universal — that's data you'd pay for. Instead it came from a $300 simulated bankroll evaporating in an interesting way. The negative result is the structural evidence that the candidate strategy might be doing something real — narrow applicability is a feature, not a bug.
Week one lessons · plain language · five bullets
Quantum TCG Genesis Edition - Limited Release - 7 Collectible Trading Cards - Rare Bitcoin & Crypto Reward Cards - Trading Card Game Booster Pack - Gifts for Cryptocurrency & Blockchain Fans

Quantum TCG Genesis Edition - Limited Release - 7 Collectible Trading Cards - Rare Bitcoin & Crypto Reward Cards - Trading Card Game Booster Pack - Gifts for Cryptocurrency & Blockchain Fans

LIMITED EDITION ALPHA RELEASE ONLY 500,000 PACKS EXIST NEVER WILL BE REPRINTED - The Quantum Trading Card Game...

As an affiliate, we earn on qualifying purchases.

As an affiliate, we earn on qualifying purchases.

Five lessons. Plain language.

What week one actually taught. The lessons are not novel to anyone who has spent serious time on systematic trading — but you don't internalize them until you watch them happen on your own paper bankroll. Out of 21 variants, one candidate worth more investigation. The ratio is roughly what was expected going in.

Five lessons crystallized · the week one observation set
Most strategies will be flat-to-losing. 1 of 21 candidate worth more investigation · the rest are either mechanical illusions, statistically-confirmed losers, or too noisy to tell apart from random. That ratio is roughly what was expected going in.
01
Win rate is the wrong metric. P&L distribution and expected value are everything. A 95%-win strategy that loses 19× as much when it's wrong is a worse trade than a 45%-win strategy that pays 2× as much when it's right.
02
The right null hypothesis is not "random." It's "whatever the market is already pricing." If your strategy isn't beating that, you don't have an edge — you have a confusing way to copy the consensus.
03
Run the same strategy on multiple markets before believing it works. If it falls apart when you change the underlying, it might be real and narrowly applicable. If it works on everything, it's almost certainly variance.
04
Disable risk gates only as a teaching exercise. Several experiments hit their drawdown limits, gates were loosened, they tripped again, gates were disabled entirely, they ran to zero. That run-to-zero was extremely informative. Doing the same thing with real money would have been a disaster.
05
Most strategies will be flat-to-losing. Out of 21 variants, 1 candidate worth more investigation. The rest are illusions, statistically-confirmed losers, or too noisy to tell apart from random. That ratio is roughly what was expected going in — but you don't internalize it until you watch it happen.

Win rate lies. Sample sizes lie. Most things that look like alpha are not. A high win rate, by itself, tells you almost nothing about whether a strategy has edge — it tells you about the kind of trades being taken, not the quality of the decisions. One strategy in the fleet has the right signature — <50% wins, 2.5× win:loss, meaningfully positive net P&L on the most liquid underlying. That's the candidate worth watching. Same code on different markets produces statistically significant losses — informative in a way "everything's green" never is. If you take this article as a reason to put money into anything, you have misread it.

— building an ai trading bot · week one · paper trading research · part 1 of an ongoing series · simulated funds only
The research lab · what's being measured
  • Underlying markets · 5-minute "Up or Down" binary prediction markets on major crypto assets
  • Strategy fleet · 21 variants in parallel · 4 strategy families × 4 underlyings
  • Bankroll model · each variant on its own simulated bankroll · isolated from the rest
  • Simulation fidelity · real market data · real order books · real fees · real latency model · simulated funds only
  • Sample size · 700+ settled trades across the fleet as of week one
  • Headline trap · 18 of 21 showing reasonable win rates · entire fleet on one underlying at >90% · 2 at 100% over 38-44 trades
  • Honest read · most of the "high win rate" variants are below the market's own implied 95% rate · slow bleed
  • Aggregate 16 sniper variants · net negative P&L despite 90% wins · 10% of losses are 19× the size of the wins
  • Candidate signature · <50% wins · 2.5× win:loss · positive net P&L · most liquid underlying · fair-value style
  • Sample caveat · several hundred trades enough to reject "useless" · nowhere near "real edge that will persist"
  • Cross-asset finding · same code statistically significantly losing on other underlyings · 99% confidence on one variant
  • Smoking-gun negative · strategy that works equally on everything = fluke · works narrowly = doing something
  • Run-to-zero · risk gates disabled as teaching exercise · $300 simulated bankroll evaporated · informative
  • Lesson 1 · win rate is the wrong metric · P&L distribution and expected value are everything
  • Lesson 2 · right null hypothesis is market-implied probability · not coin-flip
  • Lesson 3 · run same strategy on multiple markets before believing it works
  • Lesson 4 · disable risk gates only as teaching exercise · never with real money
  • Lesson 5 · most strategies will be flat-to-losing · 1 of 21 candidate worth more investigation
  • What's next · week 2 longer-horizon results on candidate · 100% win rate trap deep-dive · cross-asset and cross-regime analysis · replay testing
  • Trade secrets · cookbook stays out · findings come out · broadcasting the recipe would make whatever edge exists evaporate the moment anyone copied it
Colophon · AI trading bot series · Part 1 · week one

Set in Source Serif 4 (display), EB Garamond (essay body), IBM Plex Sans & IBM Plex Mono. AI Trading Bot research lab · Part 1 of an ongoing series · paper trading only · simulated funds only · the win-rate trap and what real edge actually looks like. Empirical-clay dominant register · labor-rose for the cautionary findings (trap, run-to-zero) · alternative-sage for the candidate-strategy positive signal · structural-slate for the statistical-rigor cross-asset negative result · transition-bronze for the week-one lessons forward horizon. Free to embed with attribution.

thorstenmeyerai.com

AI Trading Bot · Week 1 · The Win Rate Trap · paper trading research

21 STRATEGIES · 700+ TRADES · 1 CANDIDATE · 4 ASSETS · 5 LESSONS · NOT FINANCIAL ADVICE

Algorithmic Trading with Python: Build, Backtest, and Automate Strategies with Code, Data, and Real-World Market Tools

Algorithmic Trading with Python: Build, Backtest, and Automate Strategies with Code, Data, and Real-World Market Tools

As an affiliate, we earn on qualifying purchases.

As an affiliate, we earn on qualifying purchases.

High Win Rates Are Not Equivalent to Profitable Edge

This research underscores that a high win rate alone is insufficient to determine a trading strategy’s effectiveness. Many strategies can appear successful simply because they trade when the market has already priced in the outcome, leading to a false sense of skill. Genuine edge depends on the relationship between wins and losses, not just win frequency.

The findings highlight the importance of understanding market-implied probabilities and the risk-reward profile of trades. A strategy that wins often but with small gains, while incurring infrequent but large losses, can still be unprofitable overall.

Background

The experiment involves running multiple variants of an AI trading model on simulated prediction markets for crypto assets, focusing on very short-term binary outcomes. The initial week’s data shows that strategies with high apparent success rates often rely on late-market entries when the outcome is almost certain, which inflates perceived performance.

Previous assumptions suggested that high win rates indicated strong predictive signals. However, the data reveals that without considering market-implied probabilities, these numbers are misleading. Similar models applied to different assets yield vastly different results, with some variants losing money despite high apparent success.

"A high win rate, by itself, tells you almost nothing about whether a strategy has edge. It’s about the quality of trades, not just the frequency."

— Researcher

Unconfirmed Potential of the Candidate Strategy

The promising strategy with a below-50% win rate has been tested over only a few hundred trades, which is insufficient to confirm its persistence or robustness. Larger sample sizes are needed to determine if its profitability is sustainable or a result of variance.

Additionally, the strategy’s performance across different assets varies significantly, raising questions about its generalizability and true predictive power. It remains unclear whether this is a genuine edge or a temporary anomaly.

Next Phases of Testing and Validation of the Strategy

The researcher plans to run the promising strategy on a larger scale, aiming for at least ten times the current number of trades, to better assess its stability and profitability. Further analysis will focus on understanding the underlying factors that contribute to its success and whether it can be reliably replicated.

Additional experiments will explore different asset classes and market conditions to evaluate the strategy's robustness. The goal is to distinguish between true predictive edge and statistical flukes before considering real funds.

Key Questions

Why do high win rates not guarantee profits?

High win rates can be achieved by trading when the outcome is nearly certain, which often results in small gains and infrequent large losses. Without considering market probabilities and risk-reward ratios, high win rates alone do not indicate a profitable strategy.

What does market-implied probability mean in this context?

It refers to the probability of an outcome as reflected in the current market prices. Adjusting strategy performance to this baseline helps determine whether a strategy has genuine predictive edge or is simply riding the market’s already-accepted odds.

Is the promising strategy ready for real trading?

No. It is still in early testing stages, with a limited sample size. More extensive testing is needed to confirm whether its positive results are sustainable and not due to chance or specific market conditions.

What are the risks of deploying such strategies with real money?

Even strategies that appear successful in simulation can incur significant losses in real markets, especially if they rely on specific conditions or have untested vulnerabilities. Caution and thorough validation are essential before risking real funds.

What will the researcher do next?

The researcher plans to expand testing, increase sample size, and analyze different assets and market regimes to verify the strategy’s robustness and potential edge before any real-world application.

Source: ThorstenMeyerAI.com

You May Also Like

Permit renewal calendar for mobile food vendors

A new permit renewal calendar for mobile food vendors is being tested to streamline permit management across jurisdictions, helping vendors avoid compliance gaps.

The Compute Concentration Audit: When Sovereign Wealth Funds Notice Three Companies Own the Frontier

Global regulators are investigating the concentrated ownership of AI compute infrastructure by AWS, Microsoft Azure, and Google Cloud, impacting frontier AI labs.

The Anthropic IPO Disclosure Document: What the S-1 Has to Say Before October

Anthropic’s upcoming S-1 filing reveals critical financial and operational details ahead of its October 2026 Nasdaq IPO, with implications for AI valuation and regulation.

The Death of the Identical Paragraph

The traditional news wire model is unraveling as AI rewriting reduces the need for syndication. What this shift means for journalism’s future remains unclear.